The main user interface consists of several components, centred around the plot view. The main UI is shown in the image below.
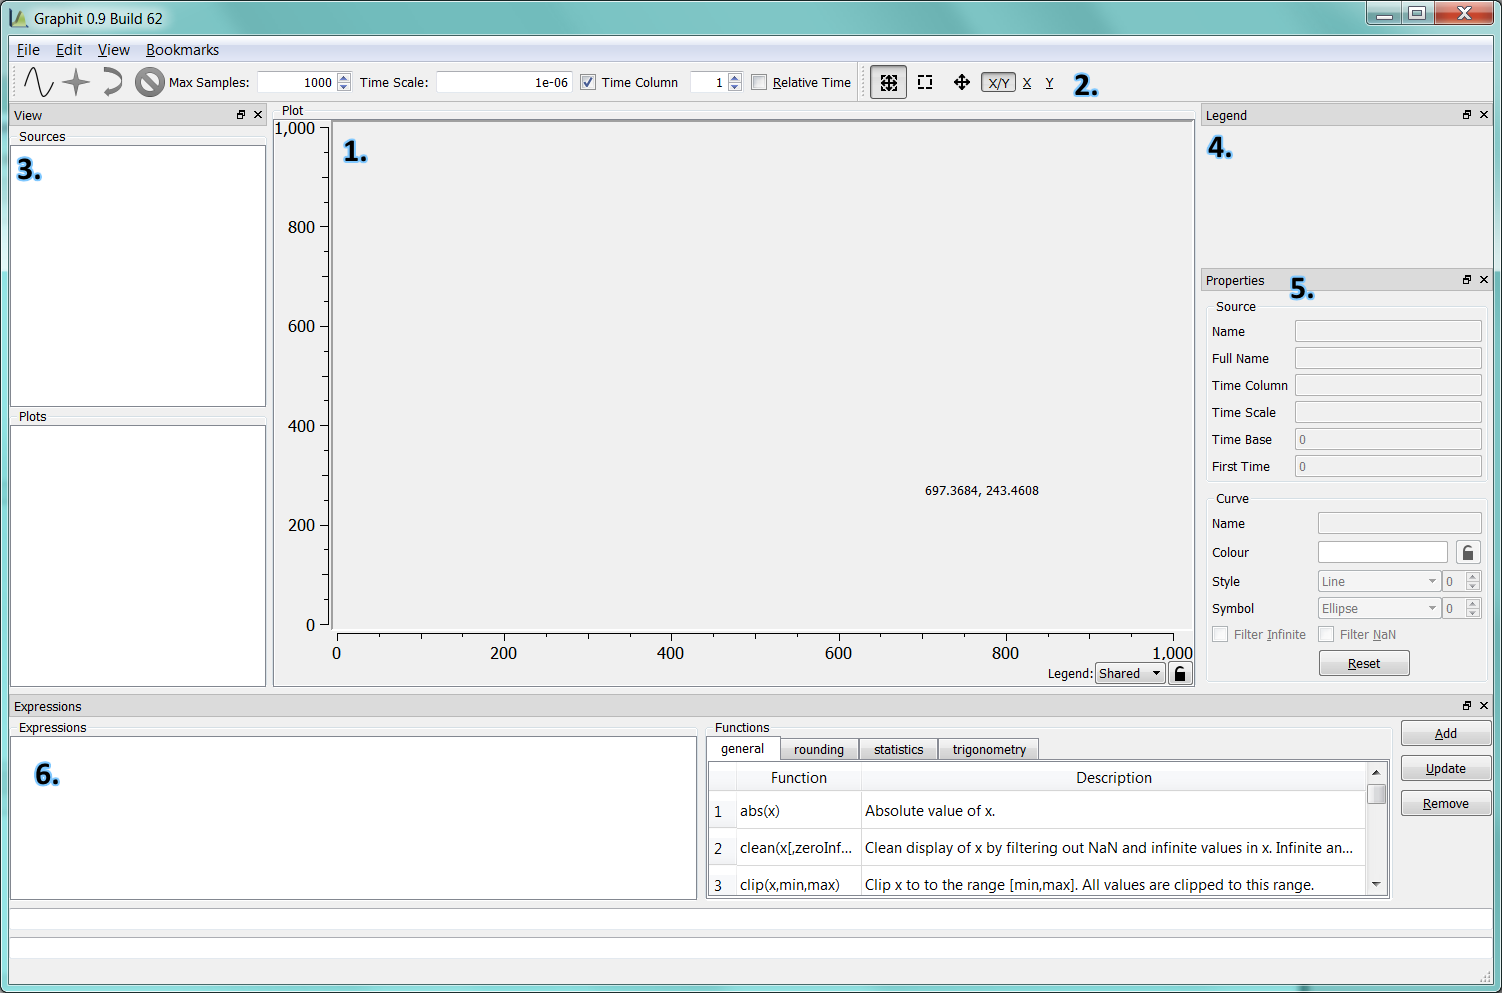
Plot View
The plot view plots currently selected data plots. Each curve is plotted in a continuous fashion, interpolating values in between data points. Curves are individually coloured by cycling through the available colour palette.
The plot view supports a right click context menu which can be used to change interactions with the plot view. Note that the context menu is accessed via a right click and hold, rather than just a quick right click. This is used to distinguish between context menu access and pan/zoom interaction with the plot view.
Time and Scaling
Open Curves is primarily intended for plotting time series data. As such, the X axis is considered a monotonic time value, while the Y value is the sample at that time. The time value associated with each line of a file source can be derived in one of several ways.
- Each data line is considered a new time value. The first line is time zero, the next time 1, etc.
- From a time data column in the file.
With a time column specified, the X value for each entry is derived by referencing the time column. The time column dictates the X value for each data sample on the corresponding line. The time column can be specified on the toolbar and affects any file loaded thereafter.
The time value may be modified by a time offset and by a time scaling multiplier. The offset is subtracted from each time value before calculating an X value, while the multiplier scales the result. Note that the offset is applied before scaling. As with the time column, the scale value can be set for in the toolbar. The toolbar does not support directly specifying a time offset, but does support "relative time", in which case the offset is derived from the first time value in the file. Both time offset and time scale can be modified in the curve properties.
Zooming and Panning
The plot view supports zooming and panning. Curves are initially loaded with auto-scaling enabled, and all selected curves are fitted to the view. The view can then be zoomed by dragging out zoom box to define the zoomed area. Zooming can be enabled for both X and Y axes, or only X or Y, leaving the extents of the other axis unchanged.
There are three modes of operation for zooming and panning:
Zoom and Pan multi-tool is designed for use with a three button mouse. The other modes are intended for use where a middle mouse click cannot easily be generated or distinguished, such as when using a touch pad.
Note that right click and hold is used to access the plot view context menu, while a quick right click is used for zoom interaction.
Zoom and Pan
The zoom and pan mode combines zooming and panning in one mode, but requires a three button mouse. The buttons are mapped as follows:
- Left: Click and drag to define the zoom box.
- Middle: Click and drag to pan.
- Right: Reset to zoom to auto scale.
- Mouse Wheel: Cycle through previous zoom levels.
Zoom Only
Zoom only mode acts like the Zoom and Pan mode, but disables middle mouse button panning.
Pan Only
In pan only mode, the left mouse click and drag results in panning only and zooming is disabled.
Splitting
The plot view can be split to show different views into the same data set. Using the "View->Split" menu item, the active view can be split either horizontally or vertically. When split, a new view is generated as a copy of the active view, showing the same data.
The active view is changed by clicking one the view to activate. The source and plot lists are updated to reflect the active view. Curves are coloured based on the active plots across all views.
View Synchronisation
Once split, views can be synchronised in order to maintain the same zoom level and pan position across different views. A view is synchronised by clicking the view synchronisation button

Panning a synchronised view pans other synchronised views by the same delta.
View Legend
Each view supports its own legend. The legend position is controlled by the legend drop down menu at the bottom of a view. There are four positions locating the legend around the outside of the view, while the "shared" legend option indicates the view should only use the shared legend control. The view positions are:
- Left
- Right
- Bottom
- Top
- Shared (default)
The per-view legend is useful when copying the view content to the system clipboard.
Plot Views and the Clipboard
The contents of a plot view may be copied to the clipboard on platforms where a system clipboard exists. The view is copied via the menu item "Edit->Copy Active View", or using it's assigned hot key (e.g., Control-C). This copies the view content at its current size as a bitmap image. The image can then be paste into another program, such as an image editing program, and saved to disk.
A legend is present in the clipboard image only when the plot view legend is position is other than "shared".
Toolbar
The toolbar contains tools and controls affecting how data files are loaded and tools which control interaction with the plot view. This includes time scaling and pan/zoom tools.
Source and Plots List
The source view displays a list of open sources and available plots from the selected sources. A source is generally a single file, but can refer to other data sources such as a real time sources. Selecting a source displays the available plots from that source in the plots list. Selected plots are displayed in the plot view.
Both source and plots lists support a context menu for modifying the selection. The source list context menu also supports removing a source, thereby removing all plots from that source. Double clicking an item in either list selects only that item.
Legend
The legend control identifies curves by colour and name. All visible plots are represented in the legend by its colour and name:
. The name is derived by combining the plot name and its source name (see Supported Formats).
Items in the legend can be clicked. Clicking a legend displays the curve properties for that item.
Curve Properties
The curve properties control shows editable properties relating to the selected curve. There are two sections to the properties; source and curve. The source properties relate to all curves loaded from the same source and include the time column, time offset and time scale. Changing one of these values affects all curves loaded from the same source.
The curve properties relate only to the selected curve and affect how that curve is drawn. The editable properties are:
- Colour - Controls the colour uses to display this curve.
- Style - Controls how sample points in the curve are displayed.
- Symbol - Allows a symbol to be drawn at each sample point.
- Filter Infinite - Supports filtering of infinite values.
- Filter NaN - Supports filtering of Not-A-Number values.
Colour
Click the colour to select the colour used to display the curve. The adjacent lock icon changed to
, indicating that this curve's colour is locked. The curve is no longer automatically assigned a colour and is always displayed using the selected colour. Click the lock again to restore automatic colour assignment for this curve.
By default curves are assigned colours from the colour palette.
Style
Curves can be drawn using one of the following styles:
- Line - Sample points are connected by straight lines.
- Sticks - Sample points are represented as sticks or bars extending from zero to the sample value. Samples are not connected.
- Steps - Samples are connected by discrete steps. The curve maintains the last sample value until a new value is available.
- Dots - Samples are drawn as discrete dots.
The line or dot thickness can also be modified.
Symbol
Sample points may be represented by a symbol, such as a square or triangle. This can be used in conjunction with the curve style.
Filtering
Infinite and not-a-number (NaN) values can be filtered, replacing such values with a zero value. The text format of infinite and NaN values is described in Supported Formats.
Colours
Open Curves uses a set colour palette to distinguish between curves. Colours are selected whenever the set of selected curves changes. The first curve is assigned the first colour, the second curve the second colour and so on. The colour palette can be changed and is edited by selecting "Edit->Colours" in the menus.
Colours can be added, removed and editing (double-click). The colour palette can also be reset to one of the pre-defined colour palettes. The default palettes include colour blind friendly palettes. These palettes have colours chosen to help distinguish curves for the colour blind. The palettes have been constructed as a best guess and may not be ideal, but will hopefully provide a useful starting point.
Expressions
Expressions provide a way of generation new plots from existing plots. Simple expressions operate on plots appearing in the plots list and can be used to scale, shift and compare plots.
Current expressions appear in the Expressions list, while new expressions are added by editing the text box below. The Functions tabs list the built in functions which can be used in expressions.
Expressions are added by editing the expressions text box and pressing Add. Expressions are removed by selecting an item in the Expressions list and clicking Remove. Expressions can also be updated by selecting an expression, editing expression and pressing Update.